I’m a self-described data nerd. I love to uncover the stories that numbers can tell us and I’m always learning new skills for data analysis so that I can become a better data storyteller. Formally, my role at Education Elements is “Academic Impact Manager,” but really, you can think of me as the person who gets to spend her time using data to tell the story of personalized learning (and who loves doing this!).
My position is new, and my presence means that we have the capacity to tell personalized learning stories with a level of depth and detail that we never could before. Using survey results, test scores, classroom walkthrough forms, results from digital content providers and more I attempt to answer a deceptively simple question: what happens when our school districts implement personalized learning?
Now, two months in, I’m excited to say that I’m ready to start sharing some of these stories and they are inspiring. We just published a report, The Positive Power of Personalized Learning, on our results from the 2014-2015 school year. The report gives a great overview of how our work affects districts, schools, teachers, and students.
So what stories do the numbers tell?
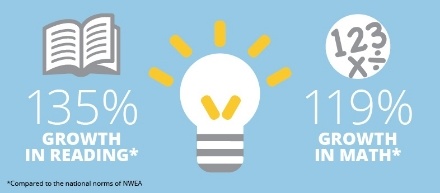
- That personalized learning impacts student achievement on nationally normed tests: Students in personalized learning classrooms showed 135% growth in reading exam and 119% growth in math.
- That blended learning helps teachers teach better: 91% of teachers agree or strongly agree that they feel more effective teaching in a blended classroom and
- That personalized learning makes meeting the needs of students easier: 100% of district and school leaders and 95% of teachers agree that personalized learning enables teacher to provide more differentiated instruction.
Our survey results from teachers and school and district leaders are phenomenal and they tell a pretty compelling story (future blog post? stay tuned!), but today I want to dig into what I mean when I say “135% growth in reading and 119% growth in math”. It certainly sounds good, but what does it mean?
Those numbers tell the story of the academic growth of students in personalized learning classrooms as measured by the Northwestern Evaluation Association’s Measures of Academic Progress. There are two things that I think are exciting about this test. (Remember, I’m a data nerd. I really am excited.) The first thing that I’m jazzed about is that the NWEA MAP is nationally normed and the second is that assessment measures student growth. Let’s unpack what those two things mean.
First of all, what do I mean when I say that the test is nationally normed?
“Nationally normed” means that there are national benchmarks. NWEA administers the MAP assessment to thousands and thousands of students across the country and then, for every grade and every subject, they look at how students perform to create a set of expectations called “norms” that help us understand how a student who takes the test should score.
Secondly, what do I mean when I say that the assessment measures student growth? Don’t all standardized tests do that?
Students take the NWEA MAP assessment multiple times throughout the school year. They take it in the Fall, some students take it in the Winter, and everyone takes it again in the Spring. The students take the test multiple times so that we can measure how much their scores improve throughout the course of the school year. We can compare that growth to national norms to know if they grew more or less in that subject than their peers across the nation. This is exciting because it doesn’t matter if a student scores low or high on the test, we can still understand the progress that they made throughout the school year. During the school year, every student starts in a different place and ends in a different place. The NWEA MAP assessment tells us not just where they end up at the end of the school year, but how much they had to grow to get there.
So when I say that students in personalized learning classrooms showed 135% growth in reading exam and 119% growth in math I am really saying that our students’ growth over the course of the school year, compared to national norms, was the same level of progress you would expect if they received an extra third of a year of instruction in reading, and an extra fifth of a year of instruction in math. That’s the power of personalized learning, and it’s a story I’m excited to tell.
Throughout this new school year I will be working to collect and analyze more data in an ongoing effort to uncover and share more personalized learning stories. As I pour over surveys, test results, classroom walkthroughs and more I look forward to sharing with you what happens when our school districts implement personalized learning.